Resist the temptation to fix the faulty product – fix the faulty process instead.
The purpose of Statistical Process Control (SPC) is to achieve a desired level of quality during the course of manufacture or service by anticipating and preventing rather than detecting defects. So by controlling the production process – or the machine making the product it is possible to consistently achieve good quality products.
This is a ‘prevention-rather-than-cure’ approach in which processes are managed up front significantly reducing the need to rectify defects after the event. Data gathered during the process control are recorded on SPC charts allowing operators to quickly see if production runs within acceptable tolerances throughout the process.
SPC is only a tool to help ensure that production output conforms to specifications it cannot rectify faults resulting from for example poor design
Although the focus is on the process not the product, SPC starts by looking at the physical product as it comes off the production line. By inspecting products you can identify critical process steps and understand where and why errors occur.
If it ain’t broke, don’t fix it…
No process is ever completely consistent or perfect. There will always be variation. The quality of raw materials may vary, machine maintenance may vary and operator performance varies etc. This is normal and should be expected. However, it is important to identify how these variations relate to the end product.
By taking samples of the finished products and comparing with performance measurement you can identify the process variations which will still produce products of the required quality. Applying the appropriate statistical formula to the measurements and plotting them onto charts, you can clearly see the normal spread of variation (or standard deviation) in the normal distribution curve of the charts.
Every process can be measured in standard deviation units and 99.7% of normal variation occurs within +/- 3 standard deviations setting the acceptable upper limit at +3 standard deviations and the acceptable lower limit at -3 standard deviations. As long as the process operates within those limits there is no need to attempt to fix it, because the variations are normal and the output conforms to specification.

Only when the measurements exceed the upper or lower limit or go completely off the chart do you need to take action and fix the problem causing the extreme variation.
As an example, the temperature in your fridge will go up and down depending on how full it is and how often the door is opened, but the temperature will always be close to the setting on the thermostat – so no need to take action if the fridge thermometer deviates a degree from the thermostat setting. However if everything is suddenly frozen or lukewarm it is time to call in the repairman.
…but keep an eye on it
Transferring measurements to charts
gives the necessary overview over the processes. It is important to choose the type of chart that is appropriate for your production, but in the
main there are two types of chart: the variables chart and the attributes chart. Charts need to be set up for each process.
On the variables
chart you monitor characteristics that can be measured, e.g. number and length of scratches. The attributes
chart on the other hand is used for making
judgements or decisions such as ‘yes’ or ‘no’ or ‘pass’ or ‘fail’.
The variables chart is a two-in-one chart which keeps track of two things:
average of measurements and range of
sample. Both average and range must be within their upper and lower control limits. In other words, the process is not running correctly if e.g. the sample range is within the control limits, but the average measurements exceed the upper or lower limit.
Samples should be taken at regular intervals and each part of the sample should be measured as required, e.g. diameter or length. Then the average of the measurement should be calculated and plotted on the average chart.
Similarly the sample range (largest – smallest) should be plotted on the range chart. Having done that you can see from the charts if anything falls outside the control limits and needs to be addressed.
Figure 2: Variables chart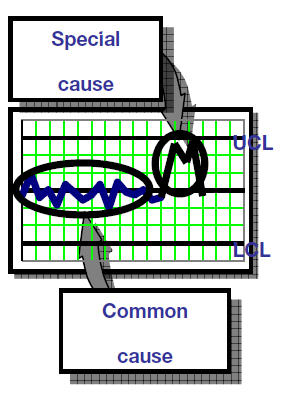
When the production event you are measuring is either present or not you should use the attribute chart, e.g. when recording if a defect such as a hole or scratch is there or not. The attribution chart to use again depends on the process being measured. If you measure batches of products the ‘p’ (percentage) chart applies since you will be interested in knowing the percentage of defects per batch. If, however you are measuring the number of defects per product you should use the formula for the ‘c’ (count) chart. Both the ‘p’ and the ‘c’ chart require the use of statistical formulas and are vital tools in identifying whether a process is in or out of control.
Focus on the special causes
Through SPC it is possible to concentrate on rectifying special causes leading to defects. E.g. (re)train operators, replace or repair faulty machinery, refuse to receive substandard raw materials. The normal causes should be
recognised as such and only be dealt with as part of an overall continuous improvement
programme.
To find out more about SPC, or how WBS Group Consultants can help your business contact us today or give us a call 01235 227 434.